Work / App Production
AVGO Thesis Monitor: scoring the evidence before earnings
AVGO Thesis Monitor is a personal decision-support web app for one stock thesis. It keeps an evidence ledger, scores what is eligible before the next earnings date, and lets Claude propose new evidence from daily news for me to approve. It never trades and its score is illustrative, not advice.
Demonstration data. Invented data; the AI scan uses live news headlines.
AVGO Thesis Monitor is a personal web app for tracking one investment thesis ahead of an earnings date. I log each piece of evidence once, say whether it supports the bull, base or bear case and how much it matters, and the app scores only what is still eligible. It never places a trade. Its own banner says the score is illustrative and the data is entered by hand.
At a glance
- Status: production. It runs every day and reports to me.
- Built: 29 June to 3 August 2026, 18 commits including documentation updates in October.
- Platform: a web app on Cloudflare Pages with a Supabase back end.
- Stack: Vite and TypeScript with no UI framework, Supabase (Postgres, row level security, authentication, Edge Functions), Vitest.
- Built with: Claude Code.
- AI inside the product: yes, in one place. Claude Haiku 4.5 reads daily news and proposes evidence. It never writes to the ledger.
One scorecard run
Text version of the video
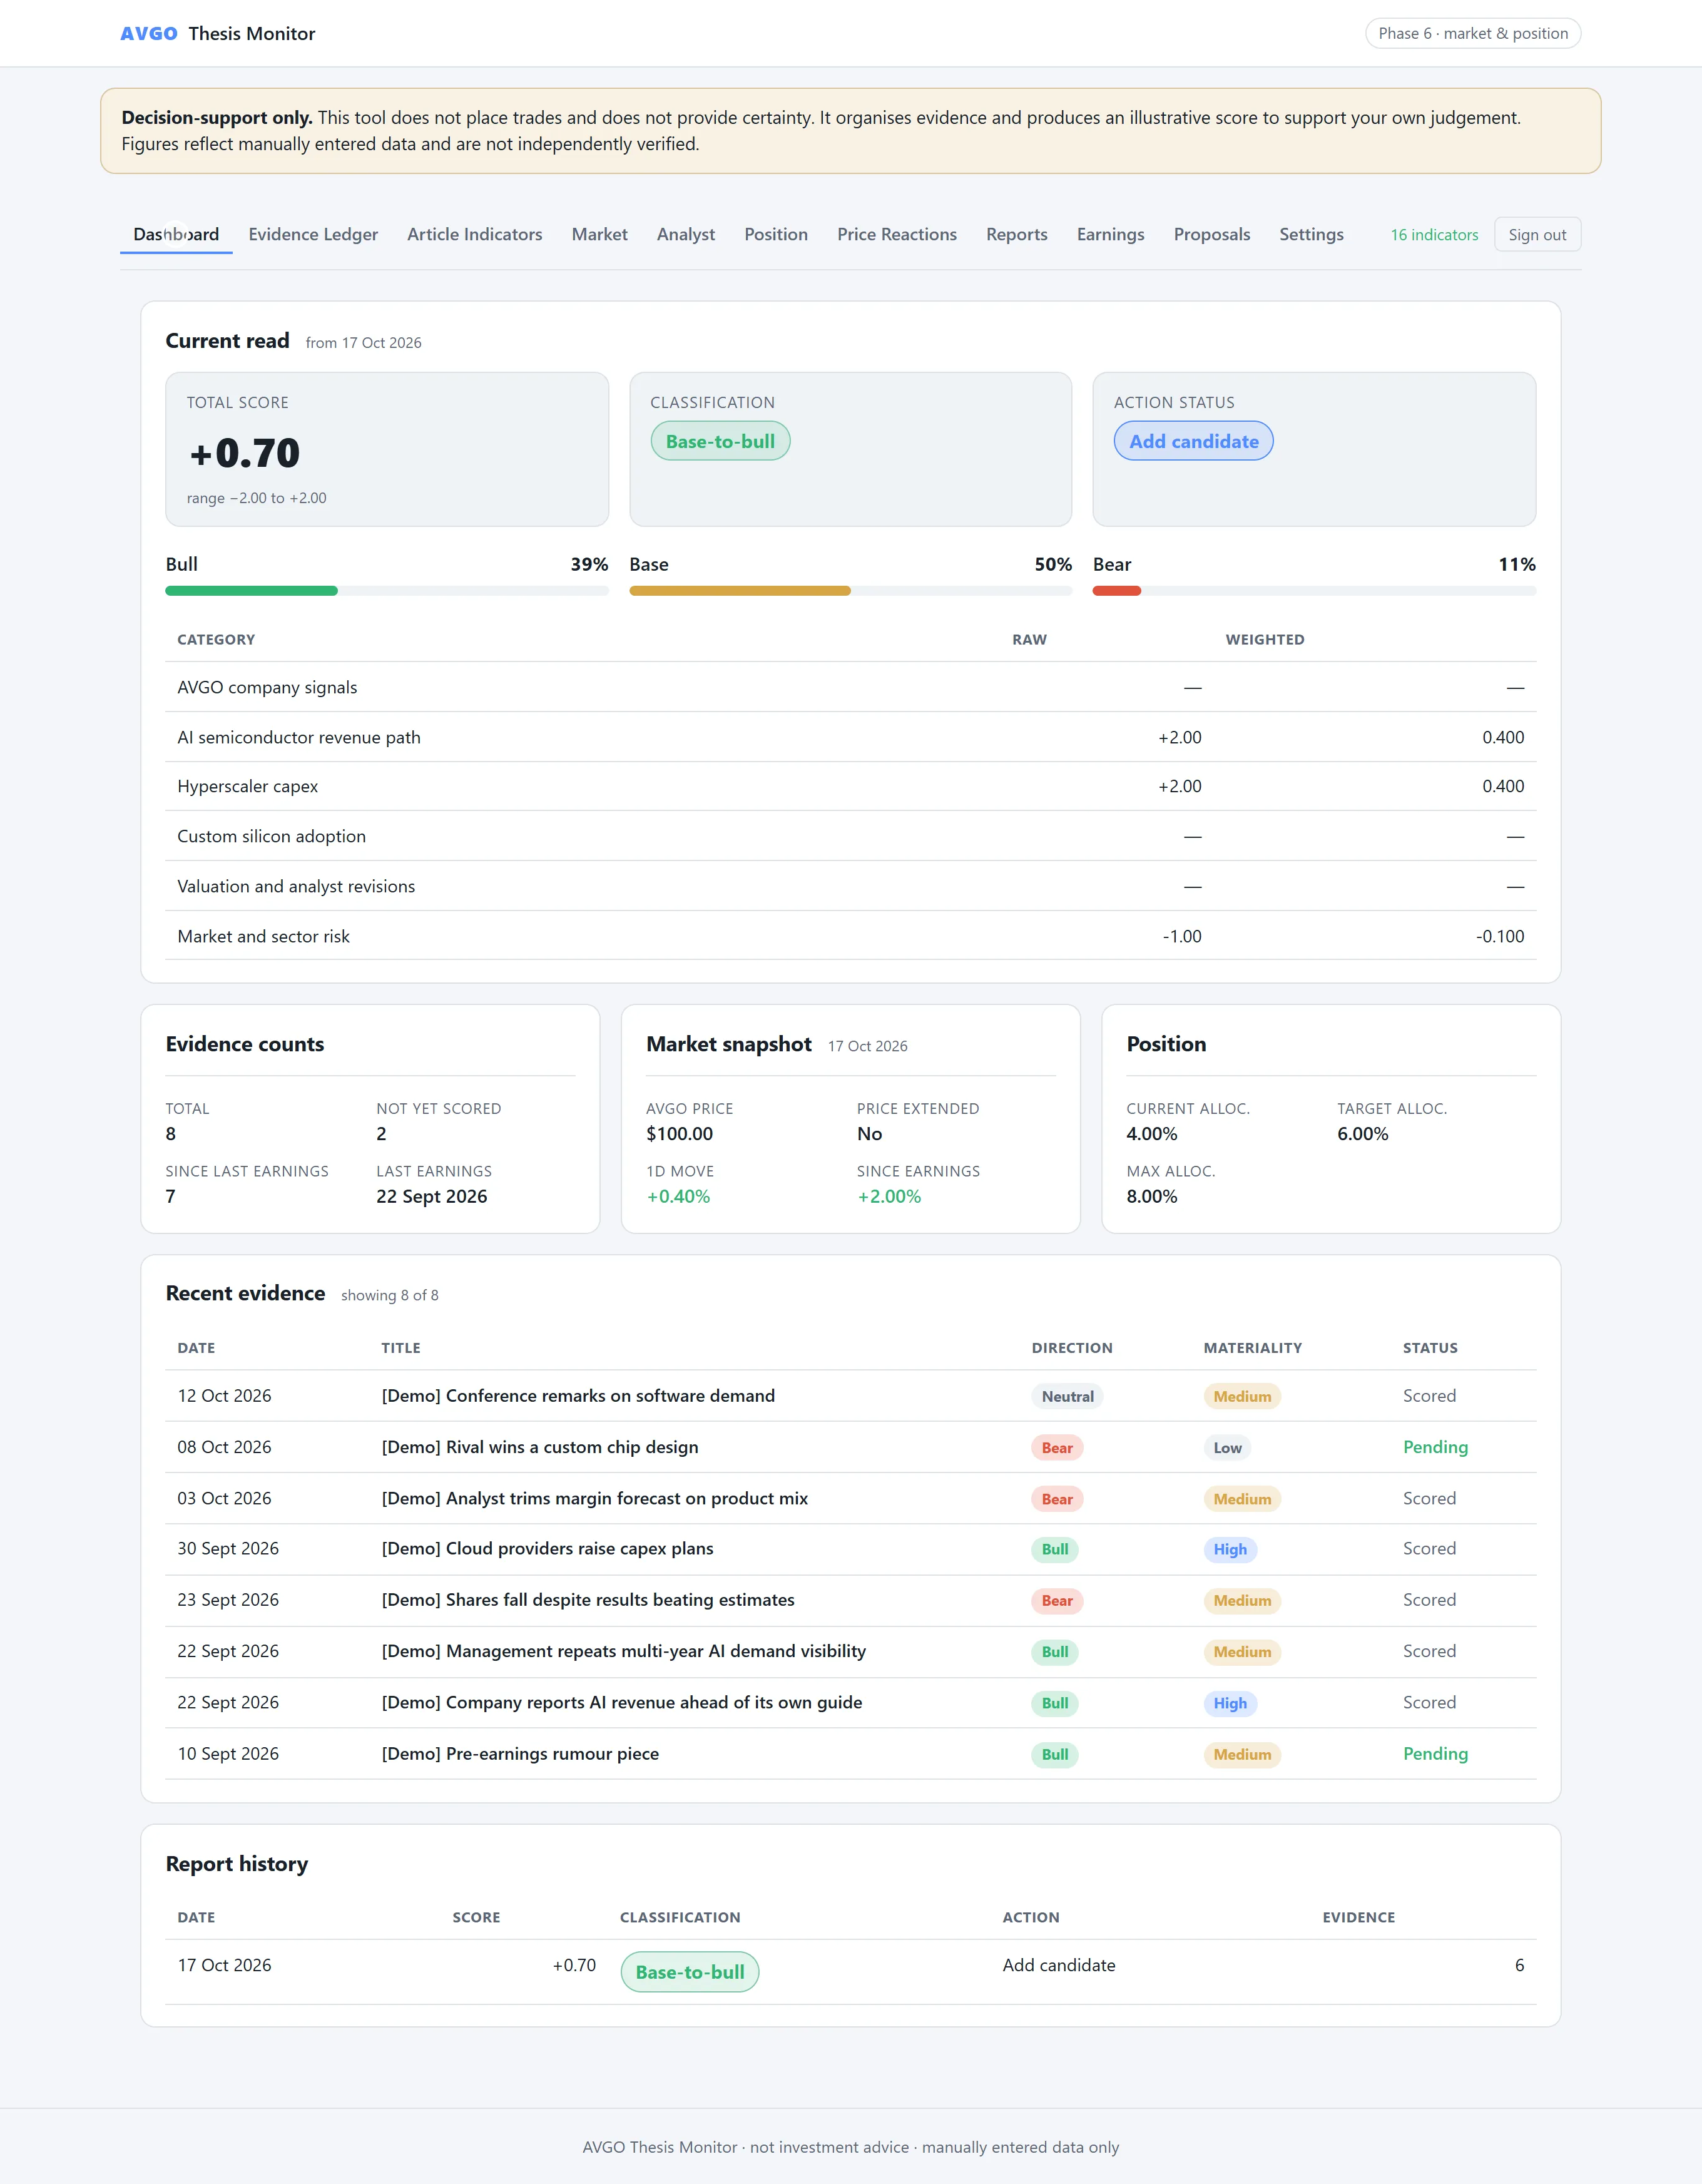
- The dashboard shows eight evidence items and no scorecard yet.
- The Evidence Ledger lists each item with direction, materiality, source tier and a freshness label relative to the last earnings date.
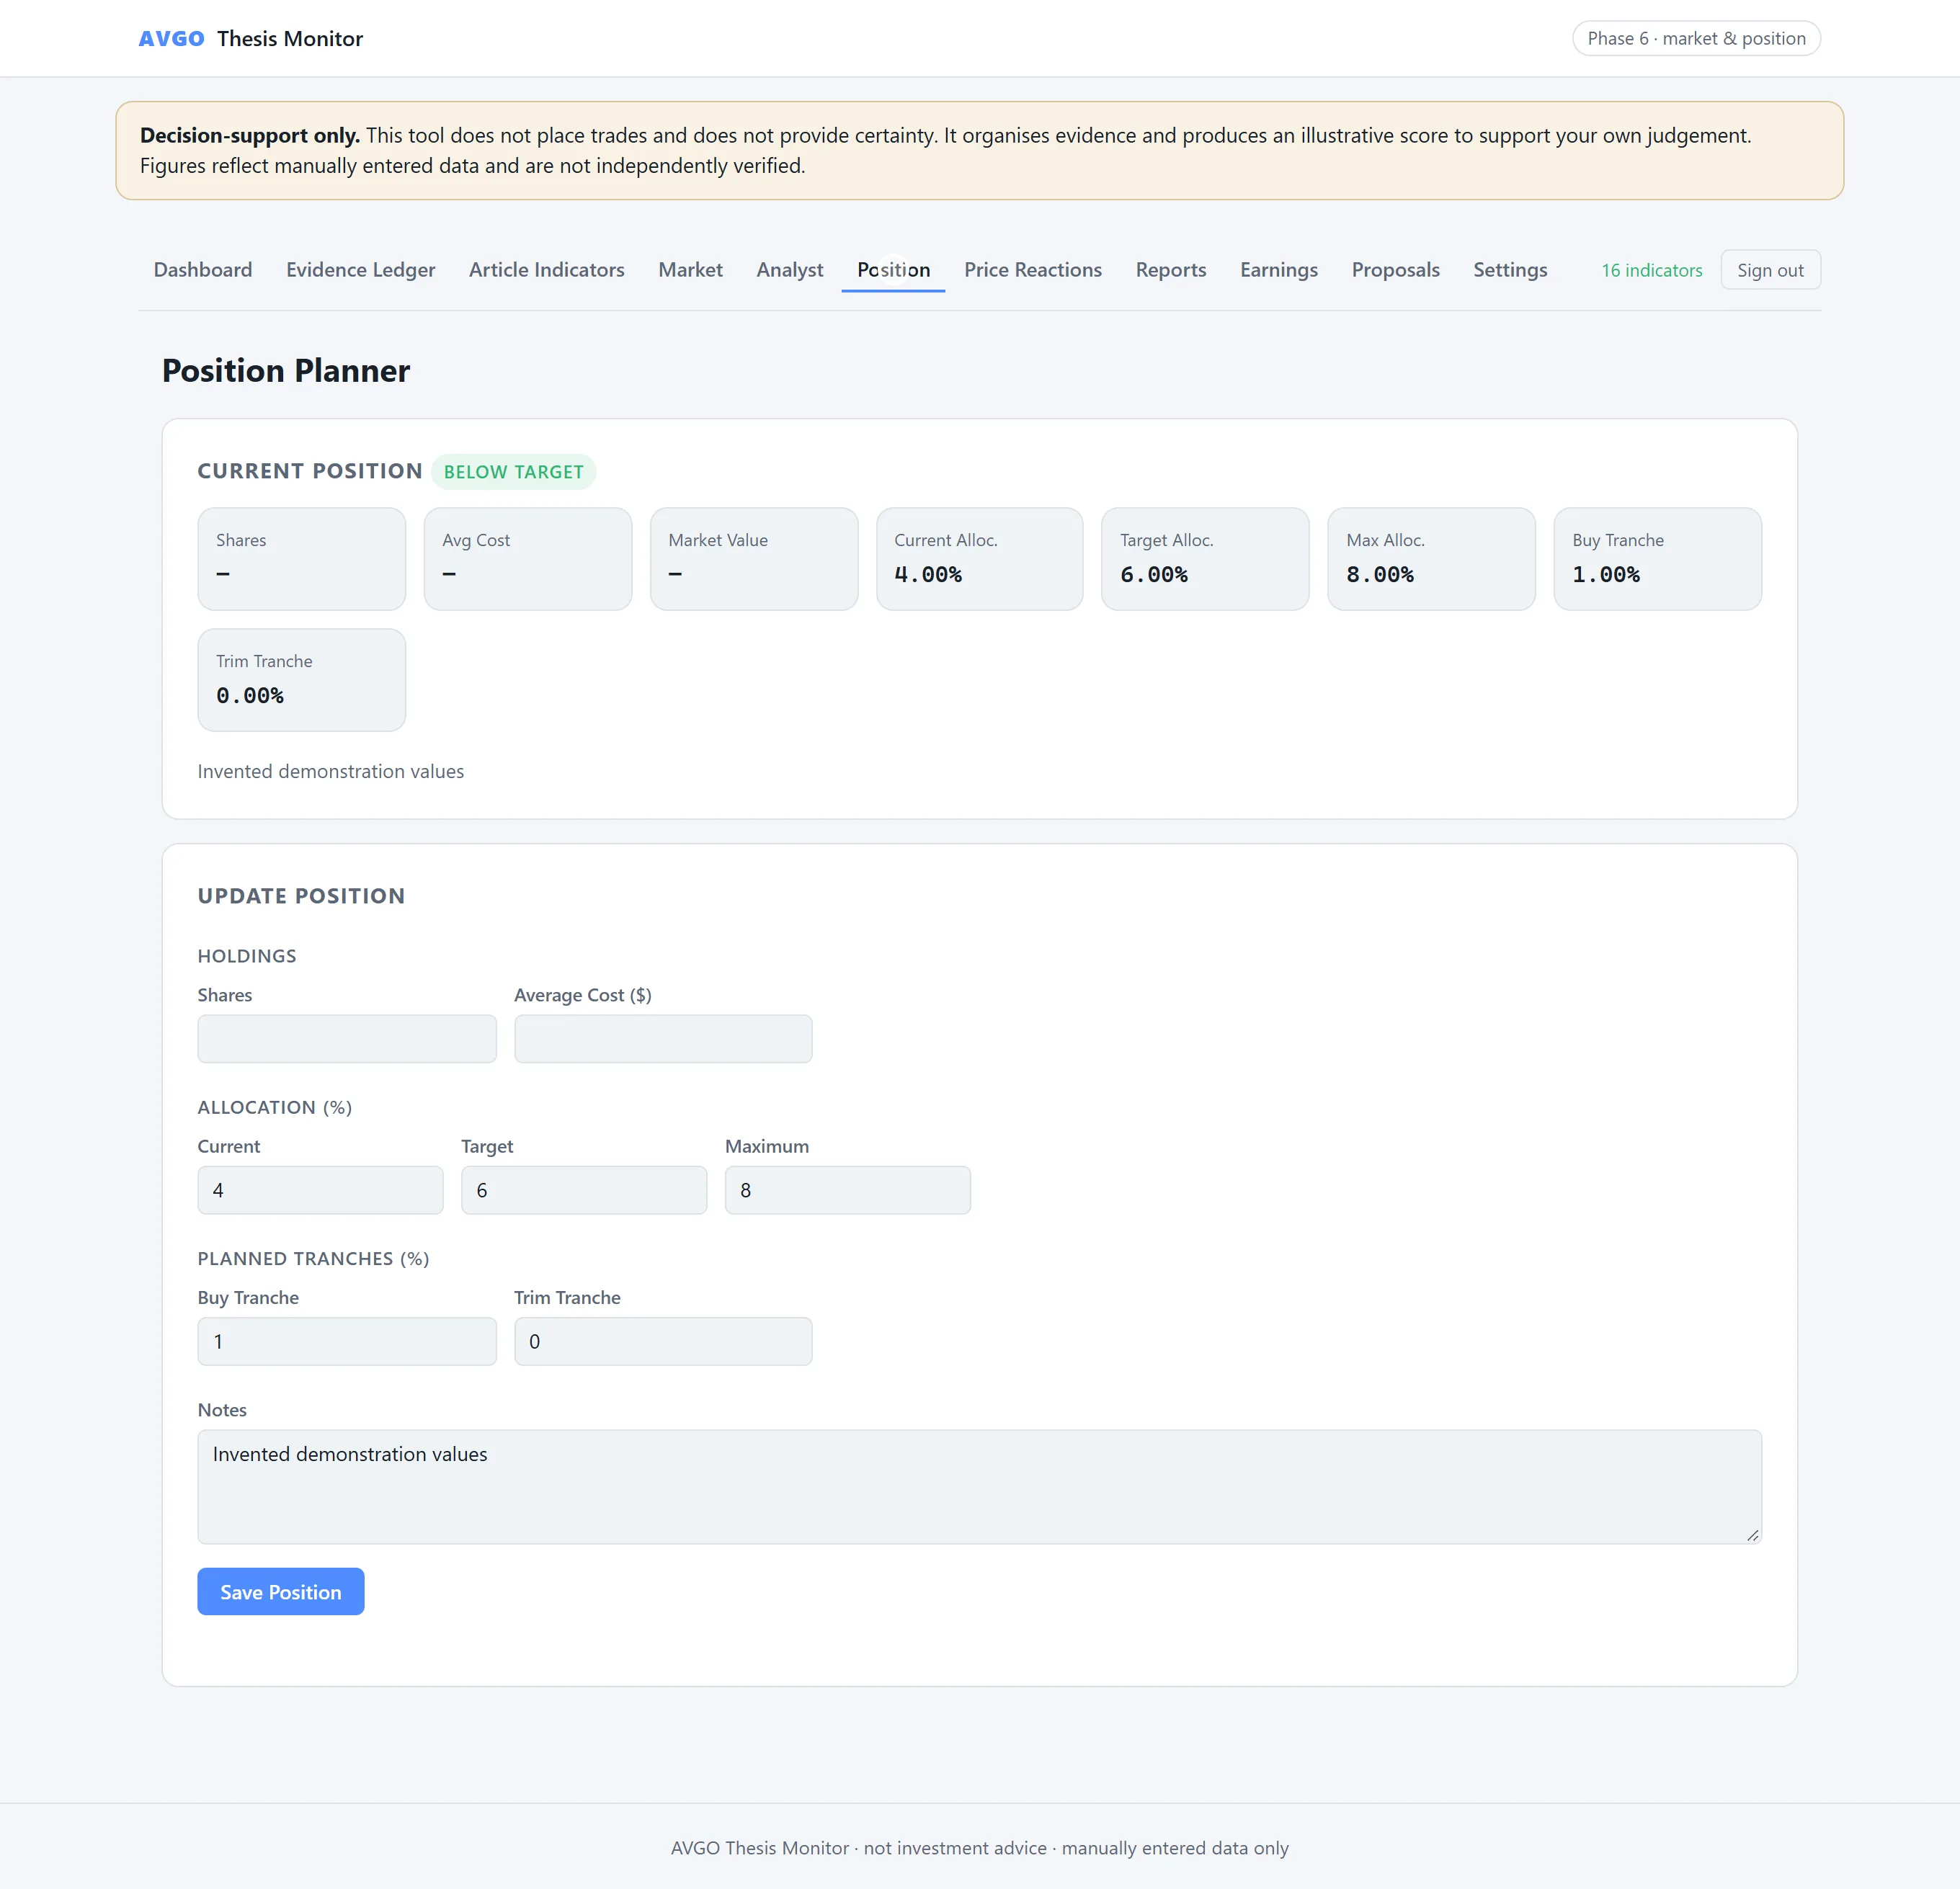
- The Market tab and the Position tab show the invented price snapshot and allocation targets, given as percentages.
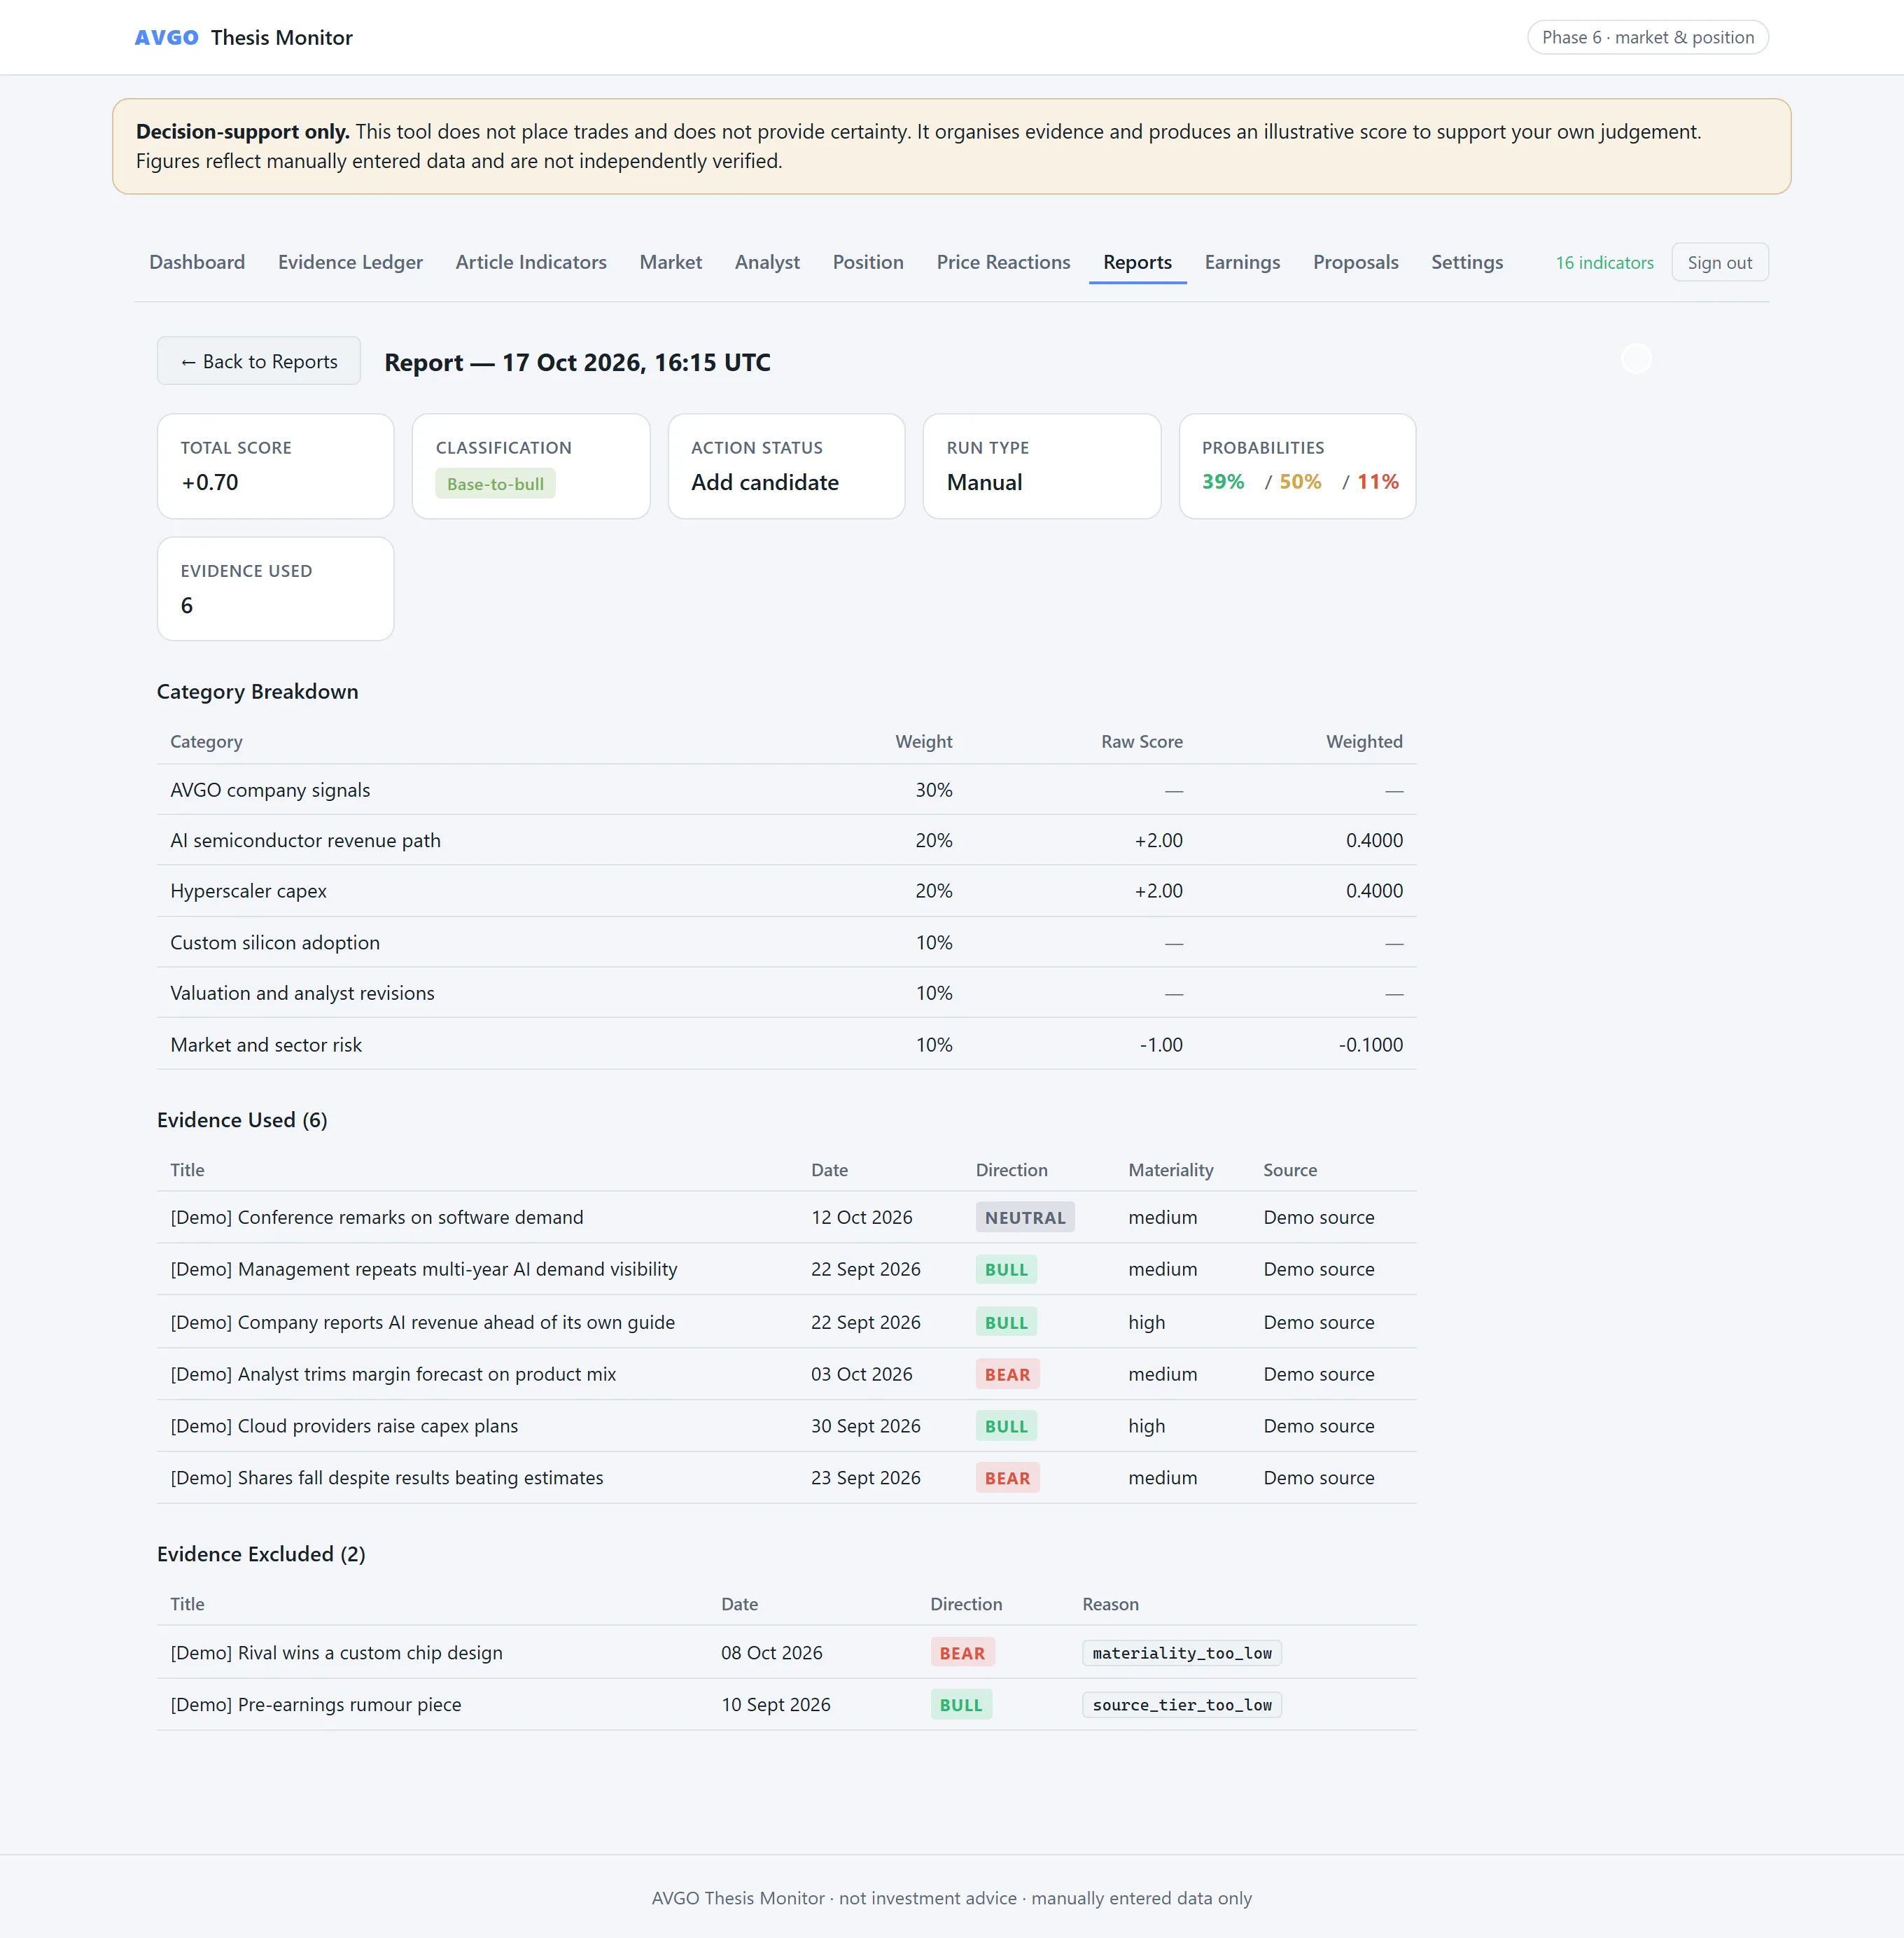
- On the Reports tab, "Run Scorecard Now" scores six eligible items. The report shows a total of +0.70, the classification Base-to-bull, the action status Add candidate and scenario probabilities of 39%, 50% and 11%.
- Back on the dashboard the same result is the current read.
A thesis is a set of claims that new information either supports or weakens. The tool keeps the evidence in one place, scores each item once under rules written down in advance, and frames its output as a prompt for my own judgement, not an instruction.
The evidence ledger and the scoring rules
The core is the Evidence Ledger. Each item carries a date, a source tier from official filings down to blogs, a direction (bull, neutral or bear), a materiality and the thesis indicators it bears on.
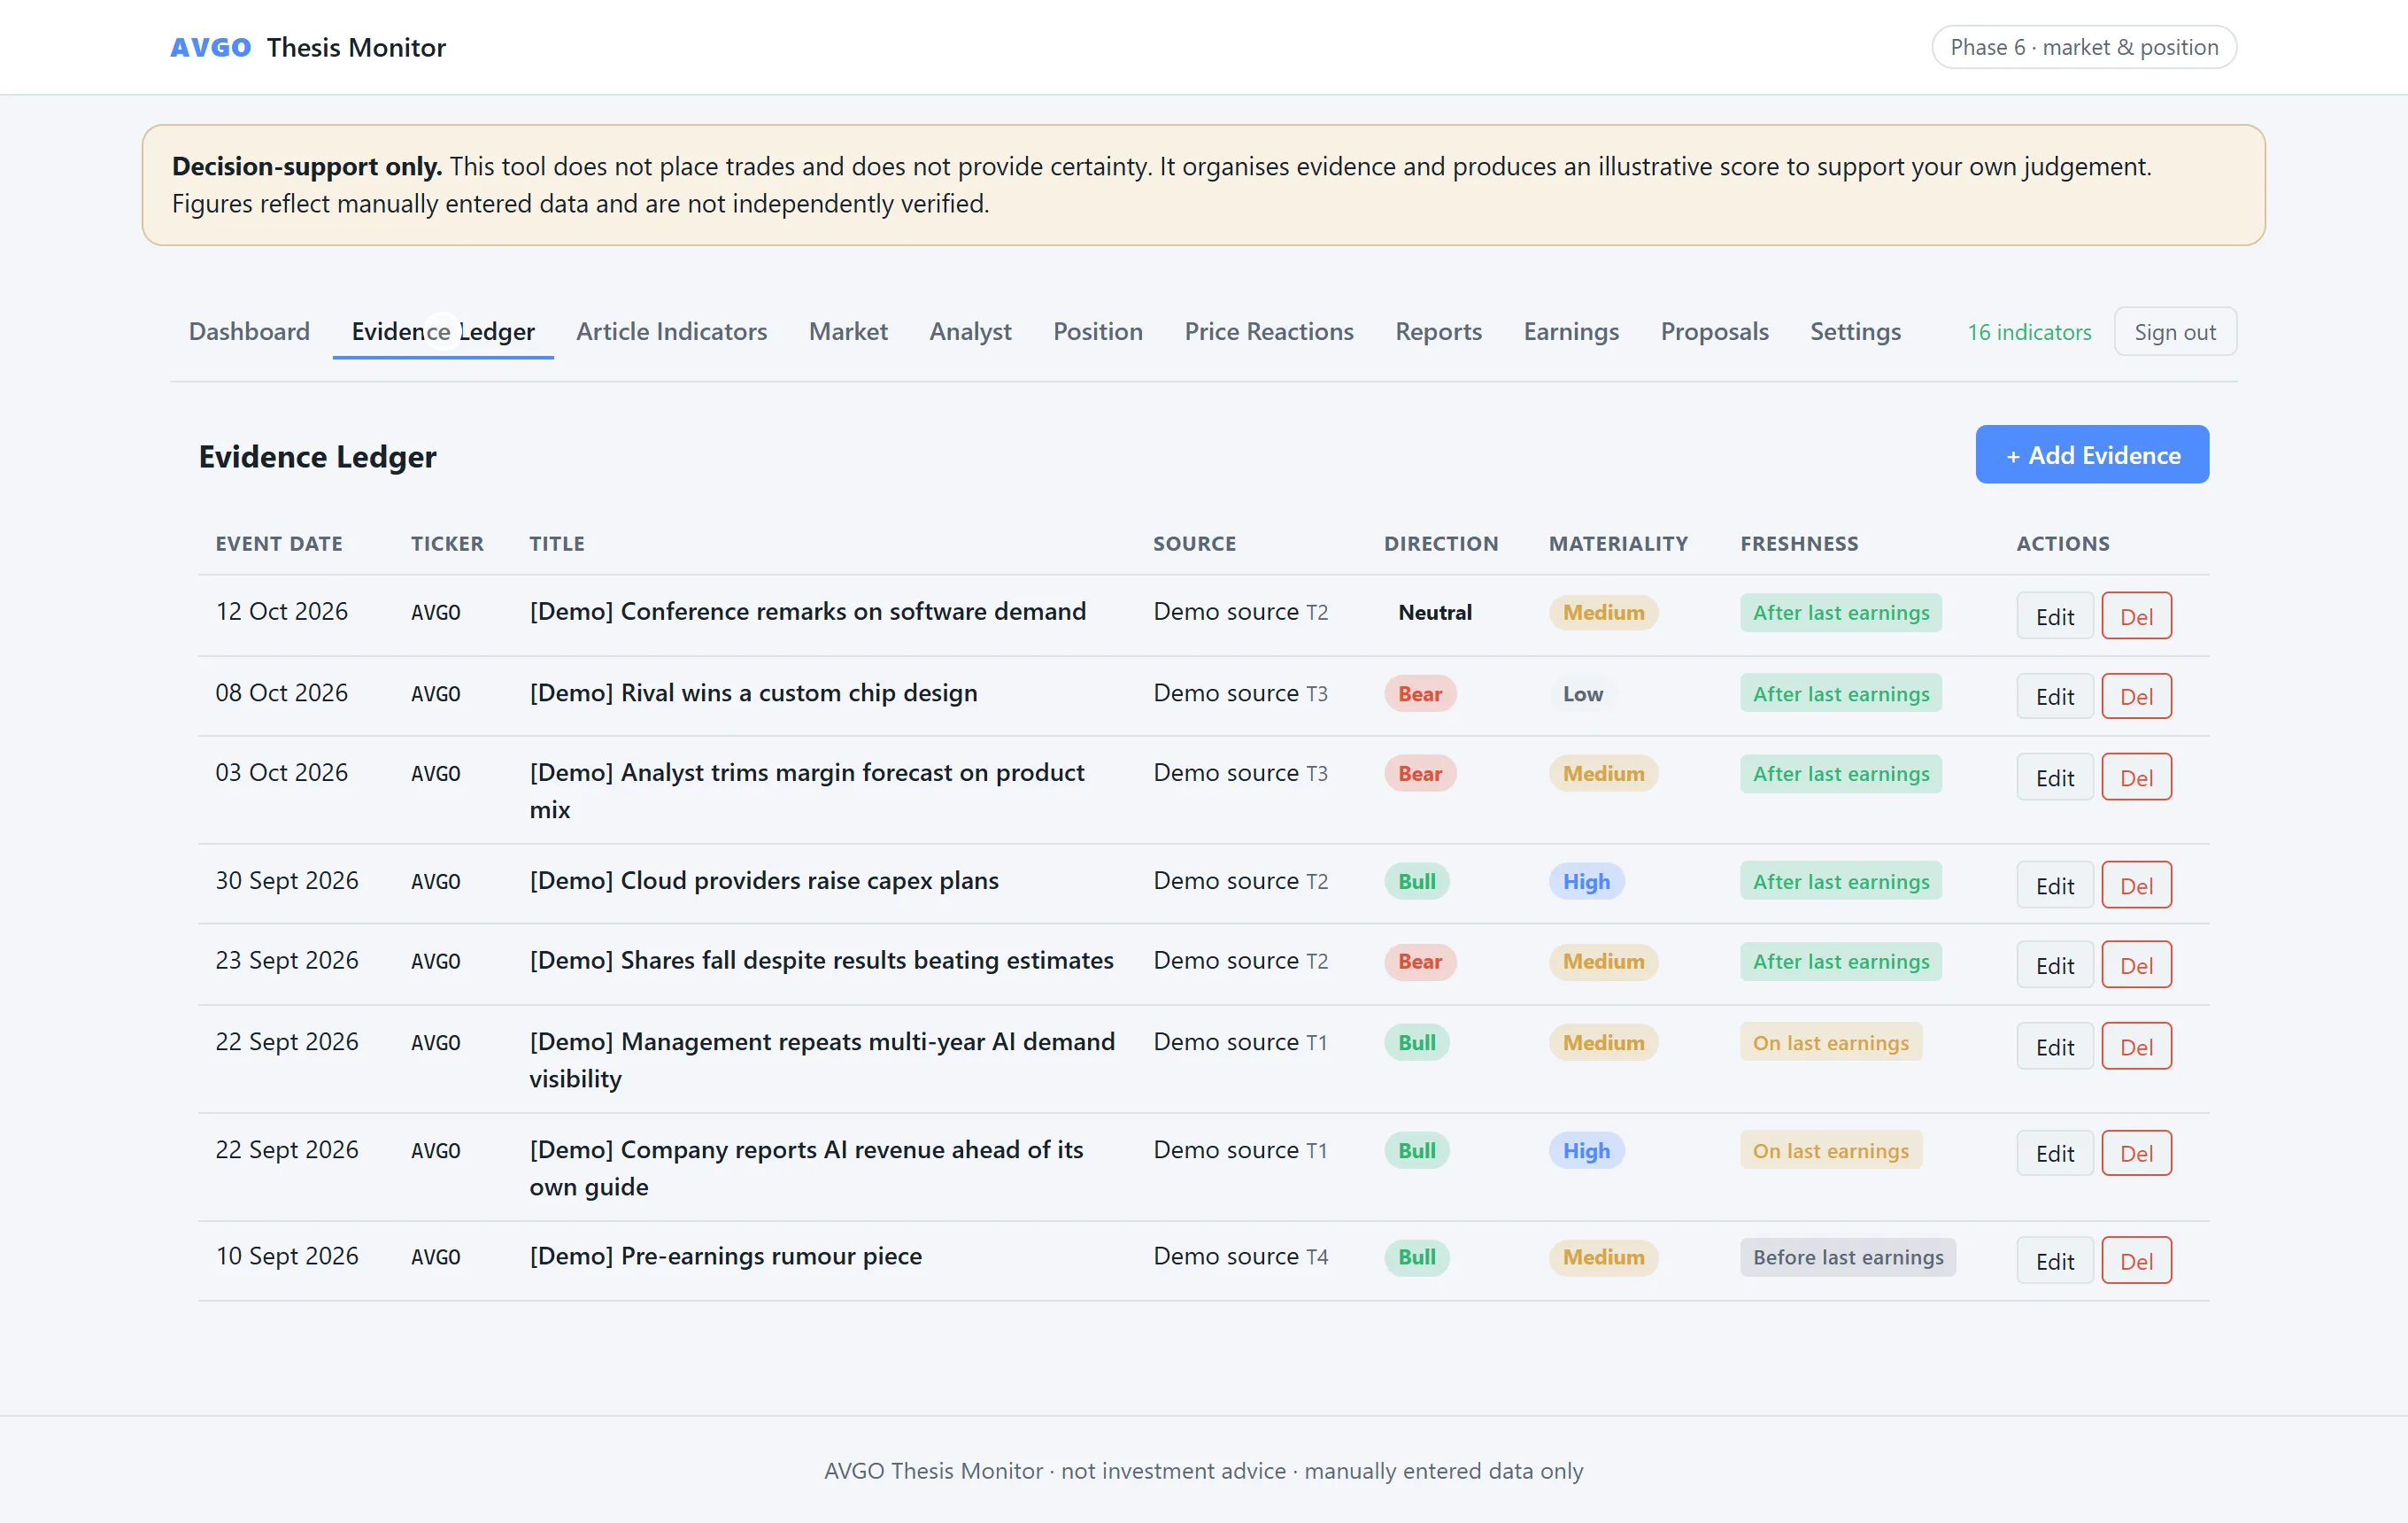
Five plain rules decide whether an item is eligible: it must be dated at or after the last earnings date (or be flagged as reinterpreting earlier news), it must not predate the previous report, it must not already have been scored, its materiality must be medium or high, and its source tier must be 1 to 3. Each eligible item becomes a score from minus two to plus two from its direction and materiality, the scores are averaged within six weighted categories, and the weighted total falls into one of five bands from Bull to Bear.
The Position planner holds allocation, target and maximum as percentages, plus planned buy and trim tranches, and shows a concentration warning. An action status comes from combining the score band with whether the price looks extended and whether the position sits below target.
Letting Claude help without letting it decide
News arrives daily and I will not read all of it carefully. A language model can read it. The design question was how to use that without a confident model quietly filling my ledger with judgements I never made.
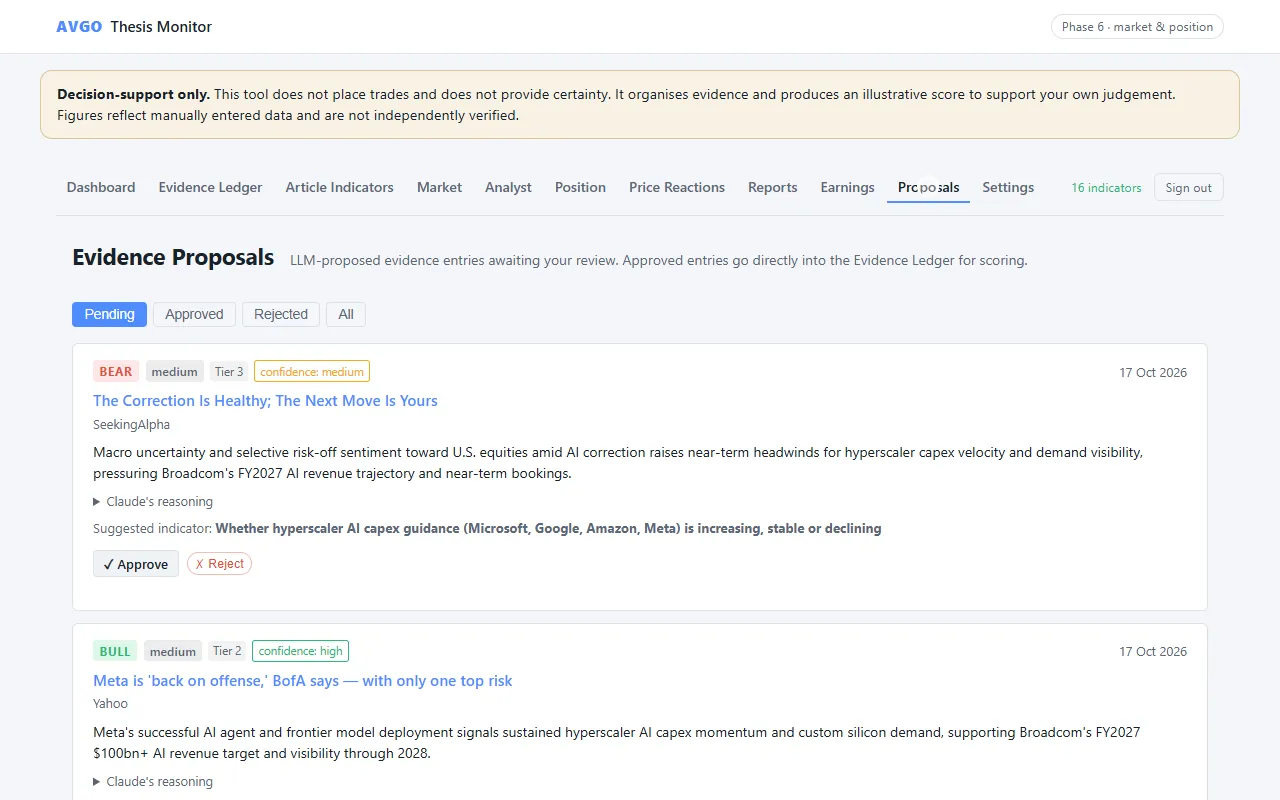
Build decision. Claude only proposes. The scanner function writes rows to a separate proposals table with the status “pending”. A row reaches the ledger, and therefore the score, only when I press Approve.
The scanner uses real news from a market-data feed. For each article it sends Claude the headline, source, date and summary, the list of my 16 thesis indicators, and the last earnings date. It does not send my position or any of my evidence. Claude returns a direction, a materiality, a source tier, a one-line summary, its reasoning and the single indicator the article most affects.
Build decision. The date arithmetic stays out of the prompt. The function compares the article date with the last earnings date in code and tells the model the answer, with a rule that news published before earnings is presumed already priced in and capped at low materiality unless it reinterprets the results. The comparison should not depend on a model getting date arithmetic right for every article.
Build decision. News feeds are scoped to one symbol, so a story about a cloud provider’s spending plans never appears under Broadcom’s feed, even though that spending is one of my thesis categories. The scanner therefore also pulls the feeds for four large cloud companies and judges those articles on thesis impact, not on whether Broadcom is named.
The scanner at work
The scanner classifies live news with Claude Haiku 4.5. The ledger around it is invented demonstration data.
Text version of the video
- The Proposals screen is empty.
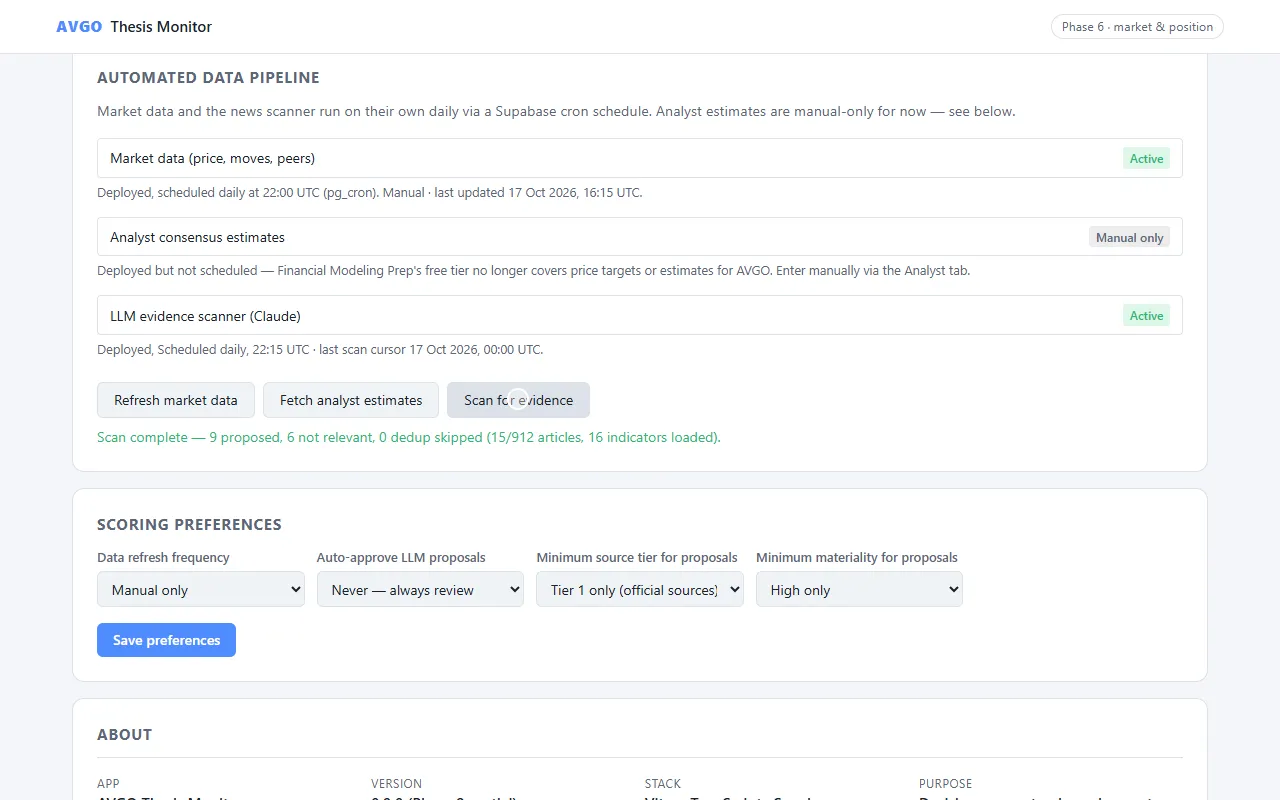
- In Settings, "Scan for evidence" is pressed and the page shows "Running".
- After about 50 seconds the result line reads: 9 proposed, 6 not relevant, 15 of 912 articles processed, 16 indicators loaded.
- The Proposals screen lists nine pending items, each with a direction, materiality, source tier, confidence, a summary, a collapsible "Claude's reasoning", a suggested indicator and Approve and Reject buttons. Scrolling shows more.
Under the hood
I built AVGO Thesis Monitor with Claude Code, starting from a product-context document that set out the product, the data model and the scoring rules, and working in phases: schema and evidence ledger, then the scoring engine, scorecard reports, market and analyst screens, and finally the earnings watch, settings, proposals screen and the daily pipeline. The project’s rules file tells the assistant to treat the data as more sensitive than the code, to use synthetic values in tests, and never to touch the live environment without asking.
| Layer | What I used |
|---|---|
| Interface | Vite and TypeScript, no UI framework |
| Logic | Scoring, eligibility, probability and action rules as small pure functions with no knowledge of where the data comes from |
| Backend | Supabase Edge Functions for market data, news and the scanner, two of them running daily on a database schedule |
| Data | Supabase Postgres, with row level security isolating each signed-in user’s rows |
| Runtime AI | Claude Haiku 4.5, in the scanner only |
| Hosting | Cloudflare Pages |
| Tests | Vitest, 33 unit tests |
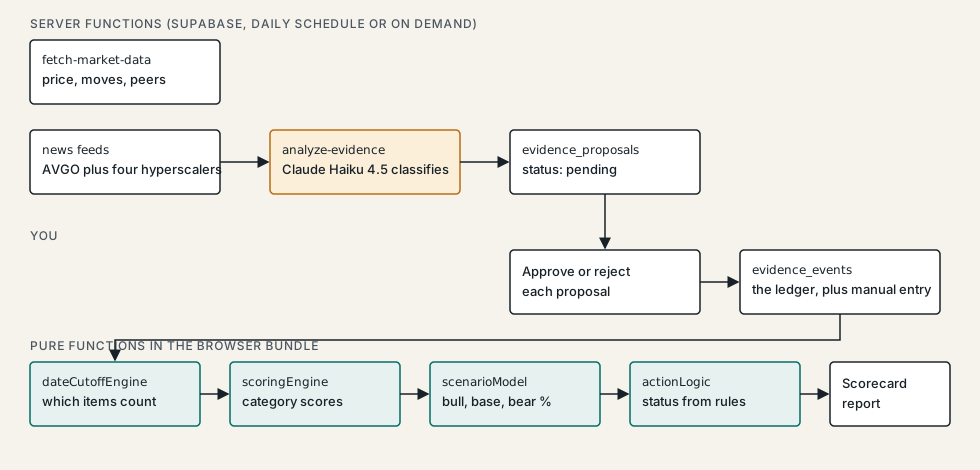
Keeping the rules as pure functions made them easy to test and let me add the news scanner later without touching them. The scenario probabilities are a fixed formula on the total score, clamped and normalised to 100. The browser app talks to Supabase with the public key, and the service key lives only in server functions. Analyst estimates are entered by hand.
What it shows
AVGO Thesis Monitor makes one consistent move: rules that can be written as code are written as code, and the language model is given only the part that is reading and judging text, with a person approving the result. That is the pattern I would use for any tool where a model should help me read but not decide.